

Systems Archetype 1:
The Google search engine was groundbreaking in the way that it created a computational methodology of evaluating the relevance, trust, and authority of a web page in order to then provide a ranking system. Since launch, almost all other search engines have adopted similar methodologies for managing search results.
A proprietary metric called PageRank (Sergey Brin & Page, 1998) works on the hypothesis that the most authoritative sources are the ones which are referenced the most. They drew this initially from competing academic journal articles, and then expanded this to apply to every single web page on the internet.
The result of this methodology is that in order to make a webpage appear higher within Google (a process referred to as Search Engine Optimization, or SEO), a search engine optimizer must increase the number of referring pages to their target page.
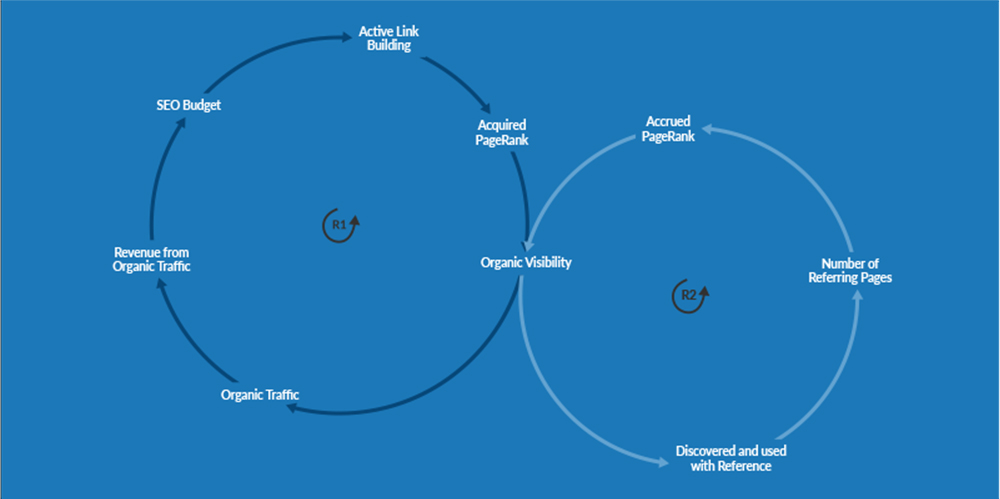
The metrics for this model are as follows:
SEO Budget: The time or money that a website has available to engage in SEO.
Active Link Building: The number of projects in which the direct objective is to increase the number of referring pages to a target webpage.
Acquired Page Rank: The amount of PageRank generated directly by a proactive link-building team.
Organic Visibility: The total visibility of a webpage within Google Search results pages.
Organic Traffic: Traffic which has been generated to a webpage directly from Google search.
Revenue from Organic Traffic: Revenue which has been generated as a result of gaining the traffic.
Accrued PageRank: PageRank which has been generated naturally, due to natural discovery and then referencing of the page from Google Search.
Discovered and Used with Reference: The number of times a third party discovers the webpage via google, and then references them from their own webpage.
Number of Referring Pages: The amount of web pages that are referencing the target page.
The Reinforcing loop occurs due to the fact that those who have the visibility already, are more likely to acquire PageRank without needing to spend budget on proactively building links. This is depicted in the Reinforcing Loop Two. At the same time, their organic visibility increases their revenue, which still allows them even further budget to proactively build more links themselves, as depicted in Reinforcing Loop One.
Systems Archetype 2:
Success to the Successful within Search Engine Optimization.
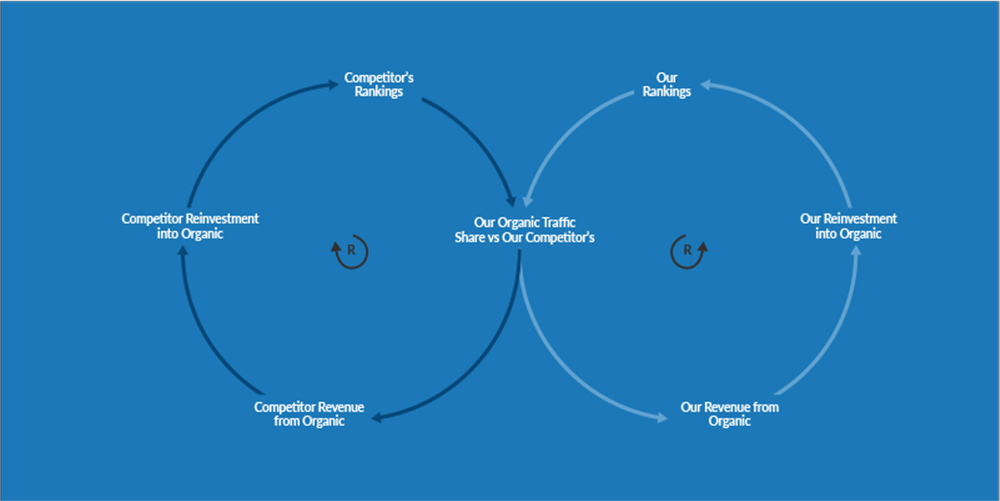
The metrics for This Model are as Follows:
Competitor Reinvestment into Organic: The amount of revenue that our competitors allocate towards improving their organic search presence.
Competitor’s Rankings: The position within Google that our competitors hold.
Our Organic Traffic Share vs Our Competitors: The amount of traffic we gain from Google search versus the amount of traffic that our competitors gain.
Competitor Revenue from Organic: The revenue generated by our competitors from organic traffic.
Our Revenue from Organic: The revenue we generate from organic traffic.
Our Reinvestment into Organic: The revenue that we reinvest into additional SEO work.
Our Rankings: Our ranking within a Google results page.
Google traffic for any given query is a finite metric, controlled entirely by the individuals who use a query. Within the industry we refer to this as ‘search volume’. If our target query had a search volume of 10,000 per month, this would mean that it is being searched by Google’s users 10,000 times per month.
When two pages are competing for the same queries, then they will inevitably be ranked against each other and then placed onto the results page which is displayed to Google’s user. Every time a user enters this query, Google processes the query against their index and their algorithm, and they generate a rank order of the available results.
Website owners can assess their websites standing within Google by using a tool called Google Search Console. This tool allows a website owner to see the following data points:
Objects Visible:
Queries: The individual queries for which your site is being found.
Pages: The pages of your website that are being displayed inside Google Search.
Metrics Visible for both Objects are:
Clicks Received: the event of a click taking place. Each click has a query associated and a page.
Impressions Gained: the event of the website being shown on a results page. Each impression has an associated query and page.
Average Click-Through Rate: the calculated average amount of impressions required before a click will be gained.
Average Position: The average position for the page or query across all impressions.
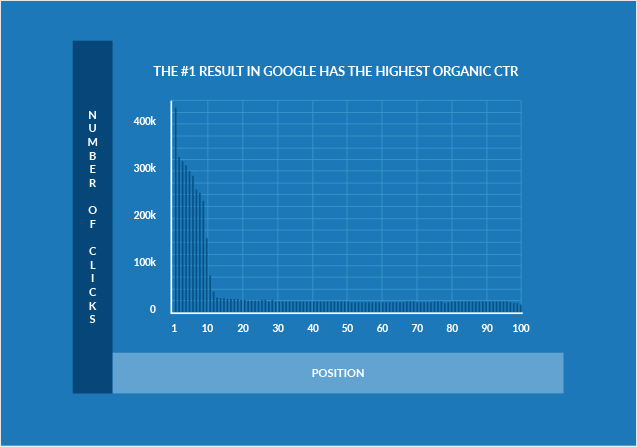
The effect of position versus click through rate is a well-researched body of knowledge within the SEO industry. A majority of this research is completed by individual brands or businesses, and then published on their blogs.
An SEO educator named Brian Dean recently analysed 5,079,491 queries, across 874,929 pages to chart the correlation between Click Through rate and Average Position.
From here, we can gather the insight that the first position within Google can be expected to average 1000% more organic traffic than even the tenth position. (Dean, 2019). Placing the CTR expectation at approximately. 31.7%, 24.71% for the second position and 18.7% for the third position. These are then evenly distributed across positions four though seven, until positions 8 through 10 are almost negligible.
From here, we can gather the insight that the first position within Google can be expected to average 1000% more organic traffic than even the tenth position. (Dean, 2019). Placing the CTR expectation at approximately. 31.7%, 24.71% for the second position and 18.7% for the third position. These are then evenly distributed across positions four though seven, until positions 8 through 10 are almost negligible.
The implication of this distribution, greatly increases the impact of the system. The ‘success to the successful’ is magnified by both larger resources being given to the ‘winners’ and the likelihood of the losers reinvesting at all if they experience successive failures across Search Engine Optimization in general.
Systems Archetype 3:
The Tragedy of the Commons Within Outreach Link Building
Within the field of search engine optimization, one of the most important exercises is the process of building links from external websites to our own websites. This leads the industry to adopt a process referred to as ‘outreach link building’ in which cold email is sent to identified owners of related websites, with a request that their website link to the client’s website.
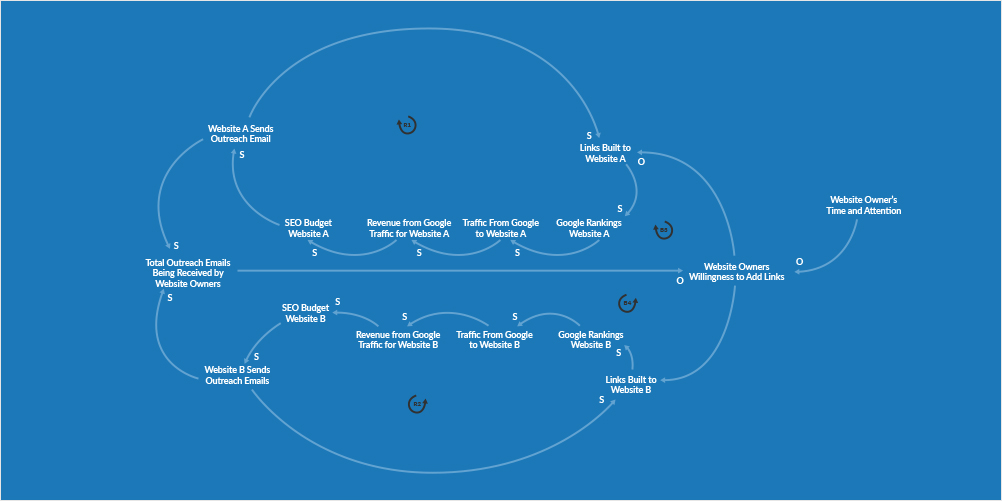
The metrics for this model are as follows:
Website A and B sends Outreach Emails: The practice of sending an email to a website owner, and requesting to either negotiate or purchase a link from their website to ours.
Links Built to Website A or B: Links that have been built as a direct result of the outreach emails.
Google ranking for website A or B: Ranking improvement resulting from having additional links, for both website A and B respectively.
Traffic from Google to website A or B: Website sessions on either website that came as a direct result of being ranked within Google.
Revenue from Google traffic to Website A or B: Revenue for either company gained from receiving the traffic. Note that there are many monetization models available, but they all rely on needing website traffic.
SEO Budgets for Website A or B: The budget of total revenue that company A and B respectively allocate to their Search Engine Optimization.
Total Outreach Emails being Received by Website Owners: The total number of outreach emails being sent to website owners.
Website Owners’ Willingness to Place Links: The extent to which a website owner who receives a request for a link email will actually be willing to place the link.
Website Owners’ Time and Attention: The limited time and energy that a website owner puts into managing their email inbox.
Both entities enjoy a reinforcing loop in which the more outreach emails they send, then the more links they will build, which directly relates to better ranking within google, therefore greater traffic and greater revenue from Google related traffic. This in turn gives them greater budgets to engage in even more outreach email campaigns. These reinforcing loops are indicated as R1 and R2 on the above system model.
For the last ten years, the number of websites engaging in link building and outreach link building has only intensified and increased over time. Ten years ago, very few website owners had ever been contacted by a link builder, which made it easier for them to achieve their objective. The link builders would typically come across as very flattering and complimentary toward the website owner’s site.
As more and more websites take up this tactic, it has over time lead to website owners receiving more and more link requests. As the amount of requests increases, the amount of administrative work required as a website owner to respond to begins to feel more like a burden or inconvenience more so than a moment of flattery.