
Creating A Funnel Chart To Optimize Your Sales Process
Staying competitive within the modern globalized ecosystem of corporate industries requires that all marketing and sales workflows of SMEs and larger enterprises be recorded, tracked, analyzed, and transformed into strategic Business Intelligence (BI). One of the most necessary and significant ways for a business to accomplish this is to utilize robust funnel charts, the cumulative result of which highlights crucial business metrics/values tied to a variety of interconnected marketing and sales phases within the sales process. While funnel charts can be utilized and optimized to represent a variety of business workflows, projects, and tasks, they are often used in conjunction with marketing processes for the representation of the overarching sales process.
Funnel charts are very useful to businesses of all sizes because they provide a visual, at-a-glance, linear summary of the sales process via a percentage-based, top-down funnel (or bar) chart. While the sales funnel chart system is great for managers in providing a general overview of optimized phases, a visual summary of key data, an analysis of conversion rates (retention rates vs churn rates), and sales bottlenecks, it can also help sales associates to understand where they can optimize their own tasks to be more efficient. Ultimately, funnel charts can help organizations operate in a more efficient manner in all phases of the sales process.
What Is A Funnel Chart?
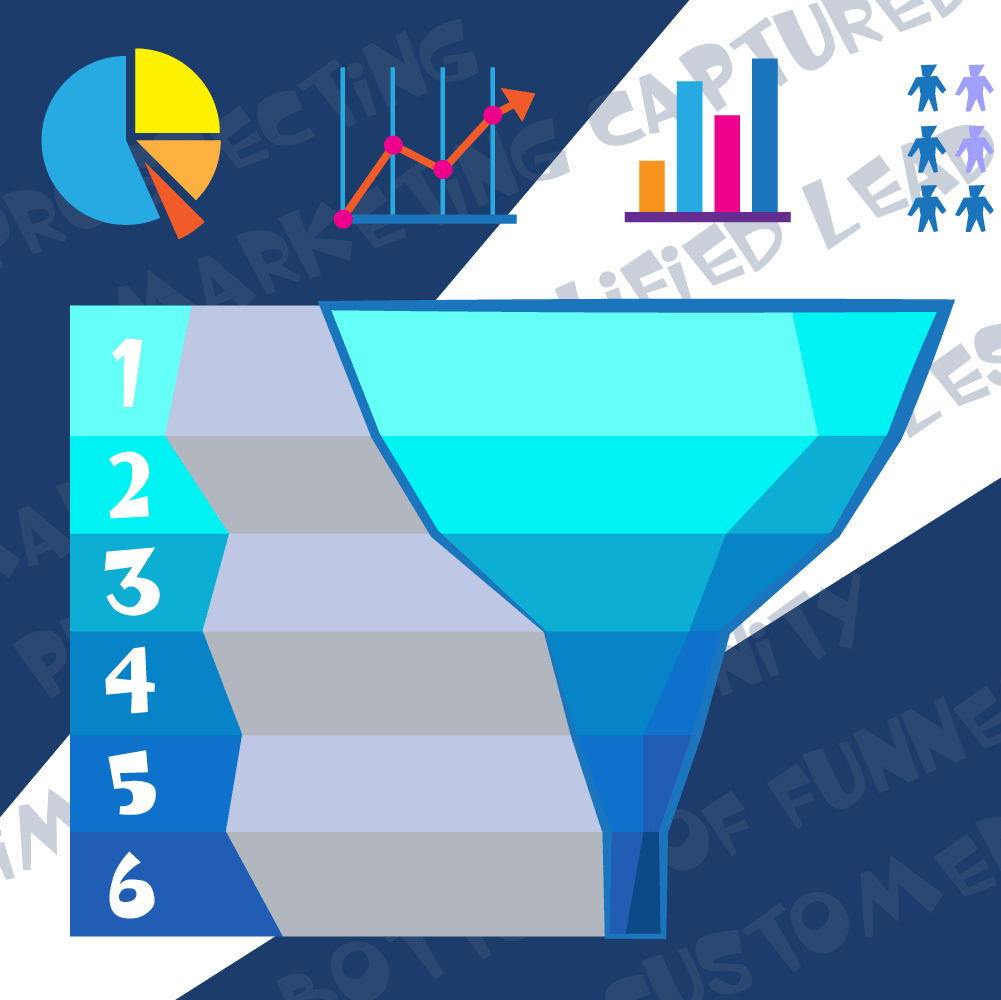
A Sales Funnel Chart is a linear chart that is represented as a visual funnel or set of decreasing bars (top to bottom), that gives an overview of interconnected stages in a process. The funnel system can be represented as a Trapezoidal funnel form, or as a Stacked bar chart, where – with the former – the areas of the funnel represent values, and with the latter, the width of the bars represents the percentage of the overall values. Each descending bar (or area of the funnel) also typically aligns with specific stages of the marketing/sales process, including the generation of a large number of leads, resulting in a closed sale. The funnel values ultimately equal 100 percent, with each descending stage representing a decreasing metric (percentage) that aligns with five or six steps or phases of the overarching sales process. The top of the funnel (the head) represents the intake stage of obtaining the interest and interactions of unqualified leads (a wide audience), and with each subsequent step, the descending percentages (represented by a narrowing funnel) represent where any fall out is occurring, up until a smaller number of leads become customers (with an accompanying fulfilled sale) at the bottom, or neck, of the funnel.
Since funnel charts show values across multiple stages in a process within a sales pipeline, along with powerful BI analytics suites and research data, quantified measurements of conversion rates, churn rates, and sales rates can be measured, reasons for failed sales can be obtained, and strategies can be optimized.
Use Cases Of A Funnel Chart
As noted above, each descending bar or funnel area represents a percentage of the total values within the sales system. This can mean different things, and can help managers obtain key values on a variety of sales processes via a percentage-based, visual overview. The main uses of the funnel chart system is that it summarizes data, identifies weak points in the sales pipeline, helps sales officers analyze rates at which leads are converted, and allows for the plotting of data relationships:
Summarizes Data
Funnel charts give not just a data-based summary of sales data, but a visual summary of data associated with the sales pipeline, thus giving an at-a-glance overview of the sales process.
Identifies Weak Points
The descending or narrowing nature of the funnel shows where churn rates are highest and also shows which sales process/phase has the highest number of leads failing to convert to customers.
Analyzes Rates At Which Leads Are Converted
Each descending process/bar (funnel area) gets leads closer to converting to customers, so the bar/funnel chart system not only gives a visual glance as to where leads fail to convert, but allows sales officers to have a concrete, visual guide as to the rates (via percentages, etc.) at which leads convert at each step of the sales process.
Plots Data Relationships
Since the funnel converts into the stacked bar system, it is easy for data scientists to utilize the data and percentages to plot graphs that can show relationships between each step/phase and their accompanying percentages.
Benefits Of Using A Funnel Chart
Funnel charts give business officers a variety of distinct advantages over enterprises that forego the use of such a system, all of which flow to the ultimate goal of the funnel system – to track the efficacy of each stage of an overall process (e.g. sales process):
A quick overview of the health of the system being tracked, giving sales officers the ability to identify which processes/tasks are working, and which ones aren’t. For the processes that aren’t working, they can be optimized to work better, thus bettering the overall conversion rates and the company’s top line.
Funnel charts reveal a general summary of sales data and associated revenue and resource requirements, while potentially aligning with conversion rates and potential problems (such as bottlenecks). The power of funnel charts is that they can be customized to fit the needs of any business.
Due to the overview nature of funnel charts, they can allow executives to see how effective the sales team is in turning a sales lead into a closed deal.
Funnel charts can be used to quickly communicate an organization’s sales process to new members of the sales team, or other interested parties.
Stages Of The Sales Funnel Chart
There are typically five to six stages of the sales funnel chart, including the prospect stage, followed by the lead or marketing captured lead stage, the marketing qualified lead stage, the sales qualified lead stage, the opportunity stage, and the closed won/closed lost stage.
Prospect
While the term “prospect” and “lead” are often used interchangeably within the sales and marketing world, in this case, prospect is associated with the precursor of an unqualified lead that enters into the head of the sales pipeline/funnel as a part of a wider audience. At this stage, the person in question may or may not be aware of the business services/products, leaving sales officers to capture the interest of the prospect by leading them to a business asset. For example, a web user who uses Facebook may be marketed via online advertising so that he/she enters onto a business web asset, and is thus a prospect. Essentially, a prospect is a potential customer, where marketers seek to convince them to become interested in their business.
Lead or Marketing Captured Lead
In this phase, marketers work to capture the interest of the prospect by ensuring that the prospect interacts with a web asset and is thus becoming interested in the company’s products/services. The prospect is “captured” if he/she does what the marketers want, like converting on a website offer to learn more about a business, the prospect becomes a lead, or a marketing captured lead.
Marketing Qualified Lead
At this stage, a lead becomes interested in a company’s products/services via website interaction (for example), and is converted into a qualified lead – a lead that is becoming convinced to solve their particular issue with the products/services of a company and shows signs of being a qualified match. This is, essentially, the “interest” stage, and while the lead isn’t fully convinced yet, from a marketers perspective, a MQL is a lead that is deemed more likely to become a customer, when compared with other leads, based on previously defined criteria and thresholds (BANT).
Sales Qualified Lead
The lead decides to consider your business as a finalist solve their issues by declaring a buying interest, such as requesting a quote, and has been vetted by sales associates as ready to be convinced to fulfill the final sale.
Opportunity
A sales opportunity has been deemed as fully ready to work with the sales team. For example, when a lead has decided to buy from a company, has fully decided what they want to buy (i.e. they are ready to buy and become a customer), and a BANT match is confirmed, they represent an opportunity that the sales team must capitalize on for a successful conversion.
Closed Won/Closed Lost
A sales opportunity can close in one of two ways: as a “won” sale or as a “lost” sale. A “won” sale is one where the lead becomes a customer by fulfilling a sale successfully, while a “lost” sale closes without the sale being completed.
Creating A Funnel Chart
The funnel chart system is unique in that it can not only be customized, but can also connect and integrate with a variety of robust enterprise suites, including data analytics engines, CRM (Customer Relationship Management) suites, Business Intelligence systems, A.I. Applications, and other business enterprise systems.
For funnel charts to work optimally, they require integration with CRM suites, coupled with their appropriate usage in order to generate charts. Such charts can help to track the sales process of specific leads/prospects/customers throughout the sales pipeline, and can subsequently help sales officers identify how best to convert failed leads into customers based on recorded – and analyzed – data. That data, in conjunction with CRM suites (e.g. Salesforce, Zoho, Pipedrive, etc.), can give more specific details about the sales process (pros and cons associated with each stage) in association with specific leads/customers as recorded in the CRM system.
Other Uses of Funnel Charts
Beyond just simply tracking the efficacy of a sales process, funnel charts coupled with other advanced enterprise engines can analyze how successful a promotional campaign is, evaluate a recruitment process, analyze and manage order fulfillment cycles, and track pretty much any business process that is carried out in stages.
From Visitors To Customers
While creating a funnel chart to optimize a company’s sales process can seem troublesome and complicated, it is worth the effort because it helps a company – of any size – forecast accurately, manage effectively and grow to desired heights.